 Customise Your Training

TechSource Systems is MathWorks Authorised Reseller and Training Partner


Data Analysis and Machine Learning, Fintech
Learn how to use MATLAB to perform statistical analysis with distribution fitting, regression, and hypothesis testing

This two-day course provides hands-on experience for performing statistical data analysis with MATLAB® and Statistics and Machine Learning Toolbox™. Examples and exercises demonstrate the use of appropriate MATLAB and Statistics and Machine Learning Toolbox functionality throughout the analysis process; from importing and organizing data, to exploratory analysis, to confirmatory analysis and simulation. Topics include:

Engineer, researchers, data scientists, and managers, who are involved in using statistical methods to analyse bigger, more complex data and deliver faster and more accurate results.

MATLAB Fundamentals

Upon the completion of the course, the participants will be able to:
TechSource Systems is MathWorks Authorised Reseller and Training Partner
Objective: Bring data into MATLAB and organize it for analysis. Perform common tasks, such as merging data and dealing with missing data.


Objective: Perform basic statistical investigation of a data set, including visualization and calculation of summary statistics.
Objective: Investigate different probability distributions and fit distributions to a data set.


Objective: Determine how likely an assertion about a data set is. Apply hypothesis tests for common uses, such as comparing two distributions and determining confidence intervals for a sample mean.
Objective: Compare the sample means of multiple groups and find statistically significant differences between groups.


Objective: Perform predictive modeling by fitting linear and nonlinear models to a data set. Explore techniques for improving model quality.
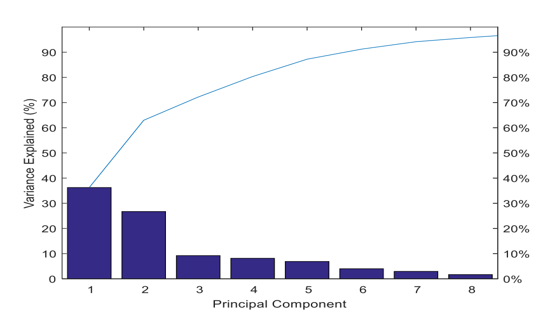
Objective: Simplify high-dimensional data sets by reducing the dimensionality.
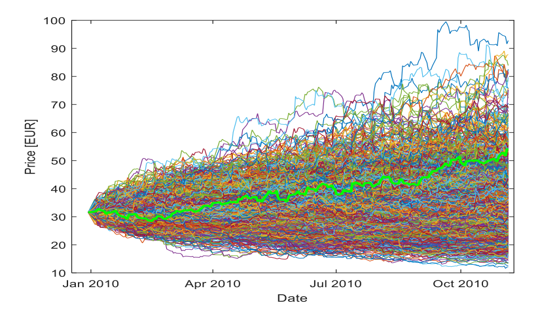
Objective: Use random numbers to evaluate the uncertainty or sensitivity of a model, or perform simulations. Generate random numbers from various distributions, and manage the MATLAB random number generation algorithms.